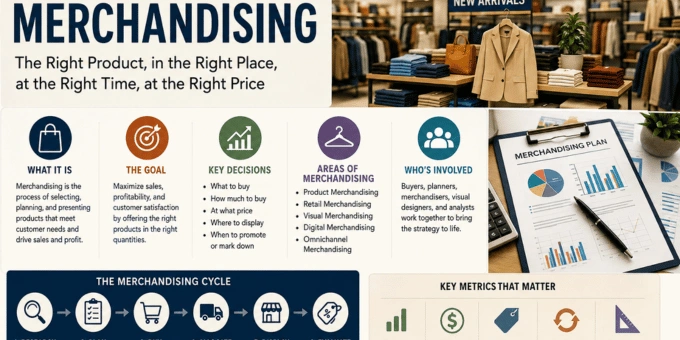
A buyer at a 40-store outerwear chain has $180,000 left in her spring budget. She can order 3,000 units of one proven parka at $60 landed cost, or split the money across three styles at 1,000 units each. She splits it, and by week eight, two styles are selling through at 71% while the third sits at 34%. That decision, repeated across every category and every month, is merchandising.
| Metric | Formula | Healthy range in 2026 | What a bad number is telling you. |
| Sell-through rate | Units sold divided by units received, times 100 | 75% to 80% by the end of a season, roughly 60% at the halfway mark | Under 50% mid-season means you bought too deep or opened too high |
| GMROI | Gross margin dollars divided by average inventory at cost | 2.0 to 3.0 in apparel and hardlines | Below 1.0 means the stock earns less than it ties up |
| Sales per square foot | Annual net sales divided by selling square footage | $300 to $600 for most specialty stores, $600 to $900 for strong grocery | Falling while traffic holds means space is going to the wrong categories. |
| Inventory turnover | Cost of goods sold divided by average inventory at cost | 4 to 6 turns a year in apparel, 12 or more in grocery | Under 2 in a fast category means aged stock is parked on the balance sheet |
| Markdown percentage | Markdown dollars divided by gross sales, times 100 | 15% to 25% in seasonal apparel | Past 30% say the buy, the opening price, or the timing was wrong. |
| Open-to-buy | Planned sales plus planned markdowns plus planned closing stock, minus opening stock and stock on order | Positive, with 10% to 20% of monthly receipts left uncommitted | Negative means you are overbought and next month’s chase money is spent |
TL;DR
- The discipline controls four levers: what to buy, how much, at what price, and where it sits.
- Six metrics grade the work, and GMROI is the one that ties margin and speed together.
- Open-to-buy is a rolling budget, not an annual one. A soft month shrinks next month’s money automatically.
- Markdown timing beats markdown depth. A 20% cut in week six usually protects more margin than 40% in week eleven.
- Planners in the US earn more than store-facing merchandisers, and the gap is roughly $20,000 a year.
The Main Types of Merchandising and Where Visual Fits
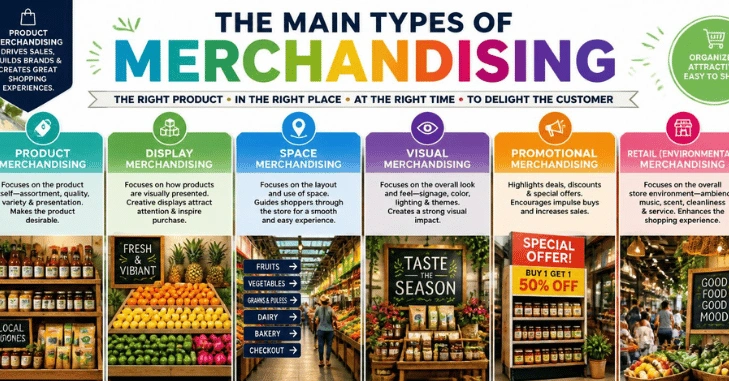
- Product. Choosing the range itself: styles, colors, sizes, price points, and how deep to go on each.
- Retail. Everything that happens once stock lands, including allocation by store, replenishment, and shelf space.
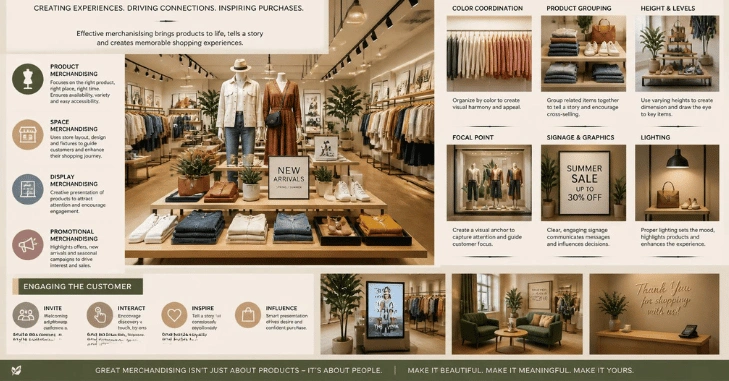
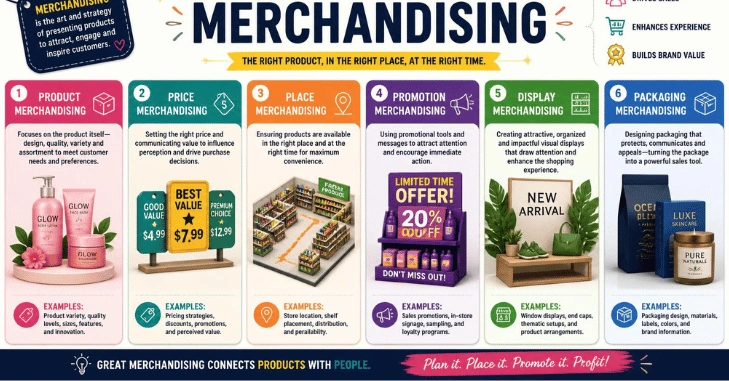
- Visual: Windows, fixtures, floor layout, and signage. This is the display craft most people picture, and it is one specialization inside a much wider function.
- Digital. Search ranking, category sort order, filters, badging, and recommended products on a site or app.
- Omnichannel. One inventory pool serves stores, the site, and marketplaces, with pricing and availability kept consistent across all three.
These five overlap constantly. A buyer who orders 12 colorways without checking how many the site’s filter panel can display well has made a product decision into a digital problem.
The Merchandising Cycle, from Forecast to Floor
Most chains run a version of these six steps, on a calendar that sits six to twelve months ahead of the shopper.
- Forecast the season. Last year’s sales by category, adjusted for store count, weather, promotions, and anything that skewed the base.
- Build the assortment plan. Decide how many options each category gets, and split the dollars between core carryover, seasonal, and test items.
- Set the buy depth. Options times units times cost has to land inside the budget, which is where the open-to-buy calculation bites.
- Negotiate and place orders. Cost, delivery windows, minimums, return-to-vendor terms, and markdown support all get settled here.
- Allocate to stores. A flagship and a suburban door do not get the same size curve or the same depth.
- Trade the season. Watch weekly sell-through, chase what works, transfer between doors, and start the markdown clock on what does not.
Apparel runs this loop hardest because the calendar is unforgiving and returns are high. Our fashion section covers the category side of that cycle in more detail.
What the Job Decides
Each team gets graded on something different, which is why they argue. The merchandising campaign is judged on traffic and awareness. A buy is judged on gross margin dollars per dollar of inventory, and no amount of clever advertising rescues 8,000 units of the wrong sweater. If you want to see how the functions fit together inside a business, browse our wider business coverage.
The Six Numbers That Grade a Buy
Every retailer runs on some version of this set. Learn the formulas, and you can read a season the way a planner does, weeks before the profit and loss statement catches up.
How an Open-to-Buy Budget Actually Works Month to Month
This is the part most explainers skip, and it is the part buyers live in. Open-to-buy is the money left to spend on stock that has not already been committed. Take the same outerwear chain planning March:
- Sales planned for March: $420,000
- Markdowns planned: $35,000
- Target end-of-month stock: $610,000
- Opening stock on March 1: $650,000
- Already on order for March delivery: $190,000
Add the first three, subtract the last two, and March has $225,000 open. That is the number the buyer can spend.
Here is the mechanic nobody explains. If March sales land at $370,000 instead of $420,000, the chain carries $50,000 more stock into April than it planned. April’s opening stock rises by that amount, so April’s open-to-buy falls by the same $50,000 before anyone has renegotiated a single order.
Two soft months in a row and the budget for the strongest selling weeks of the season has already been eaten by stock nobody wanted. That is why the calculation gets rerun monthly at minimum, and weekly in fast categories. Cutting a receipt in February is cheap. Canceling a purchase order in April costs a supplier relationship.
Pricing and the Markdown Clock
Initial markup sets the room you have. Many vertically integrated apparel retailers open at an initial markup near 60% to 65%, precisely because they expect to give a chunk of it back later.
What separates a profitable season from a bad one is usually when the first cut lands, not how deep it goes.
Picture 1,000 units, a 13-week selling window, and a $100 ticket. Cut 20% in week six, while shoppers are still buying the category, and you might clear 800 units at an average of $84. Wait until week eleven, and you are competing with next season’s arrivals, so it takes 40% off to move 600 units at an average of $71. That second path leaves 400 units for clearance and a worse margin on everything sold.
Three steps beat one big cut: around 20% first, then 30%, then clearance, each triggered by the sell-through curve rather than the calendar. Set the trigger in advance. If a style has not cleared 50% by the halfway mark, it goes down that week, no debate. Software that reads the curve and recommends the cut has moved from enterprise-only to affordable, and our tech section tracks that shift.
When Two Numbers Disagree
Single metrics mislead. Pairs are where the diagnosis lives.
- High turnover, low GMROI. Stock moves fast because you keep discounting it. Speed is being bought with margin.
- Strong sell-through, weak sales per square foot. The range works, but it is under-bought, so you sell out early and the floor sits empty.
- Low markdown percentage, rising aged stock. Markdowns are being avoided rather than earned, and the write-off is being deferred to next season.
Merchandising as a career
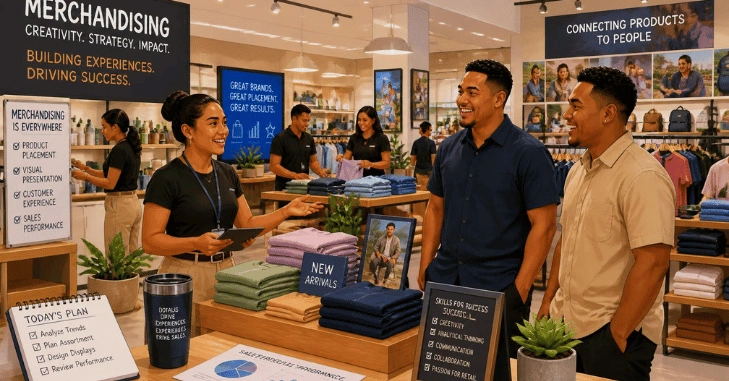
Most ladders run allocator, assistant buyer, buyer, then planner, merchandise manager, and divisional director. Planning and buying split into two tracks at most large chains, with buyers owning the range and planners owning the money.
US salary aggregators in 2026 put store-facing merchandiser roles at roughly $55,000 to $58,000 a year, merchandise planners near $79,000, and retail planners around $82,000. Buyers at national chains commonly sit higher still. Pay tracks the size of the budget you are trusted with. Entry to the job is not about taste. It is spreadsheet fluency plus the nerve to cancel your own order when the sell-through proves you wrong.
Where to Start
Merchandising: Pull your last completed season and calculate two numbers: sell-through by style at the halfway mark and GMROI by category. The styles that were already under 50% by mid-season are the ones that ate your margin, and you will usually find you knew it at the time. Set the markdown trigger before the next season lands, and let the math make the call.
Frequently Asked Questions
No. Marketing creates demand and brings people to the store or the site. The buying and planning function decides what those people find when they arrive, how much of it there is, and what it costs.
Reads last week’s sell-through by style and store, then adjusts allocations. Chases the winners with suppliers. Sets markdown triggers on slow sellers and updates the plan against the open-to-buy number.
It depends on the category speed. Seasonal apparel aims for 75% to 80% at full price by season end, while grocery and consumables run far higher because they replenish weekly.
Yes, and arguably more than chains do. A single store with $40,000 tied up in stock that will not sell has no other budget to borrow from.
GMROI. It folds margin and turnover into one figure, so it catches the two most common mistakes at once: cheap stock that never moves and fast stock sold at no profit.